Frequently Asked Questions
Glossary of Terms
Fundraising Productivity (or Production)
Totals are calculated using campaign counting standards. This includes All new gifts (hard credit), new pledges, and new planned gift commitments. It does not include pledge payments or planned gift payments on previously counted commitments UNLESS the payment exceeds the initial commitment amount. Proposals are, also, not included.
Fiscal Year vs. Metric Year
Fiscal Year: September 1 – August 31
Metric Year: June 1 – May 31
Reports ending in “MY” follow the Metric Year for ONLY Gift Officer goal tracking. All other reports go by the Fiscal Year and SHOULD NOT be used for Gift Officer goal tracking.
HSMB
Individual or Household’s giving totals are combined using the combination of:
Hard Credit
Soft Credit
Matching Gifts
Balances
Hard Credit
Cash in the door!
Soft Credit
Value of a gift attributed to an individual whose gift came from a different source. The donor will receive $0 hard credit and another legal entity receives the hard credit for making the gift.
VSE Survey
Voluntary Support of Education Survey issue for the Council for Advancement and Support of Education (CASE) to offer U.S. higher education institutions the opportunity to understand year-over-year trends compared to their peers. Look up report LT00A | Development Performance Dashboard
ALF Survey
Organized by consultants GG+A (Grenzebach Glier + Associates), the Advancement Leadership Forum (ALF) is a group of the best fundraising organizations in higher education. The ALF surveys supports benchmarking between the member schools. Click here for more information
Proposal Statuses
Delivered – Gift Officer delivers a written proposal or gift agreement to the prospect
Awarded – When a gift has been received or a GO has received proper documentation from a donor regarding a pledge.
Rejected – if a prospect declines to make a contribution
Expired – no action when a gift conversation has stalled and the GO has not received new information regarding the prospect’s interest in the proposal.
For more information, please visit: Prospect Management Policy: Individual – DevConnect (utexas.edu)
Collaboration Credit
Started by former Vice President Scott Rabenold, Collaboration Credit is an incentive for gift officers to work together on multi-interest prospects. Utilizing Proposal Tags in VIP, gift officers & CSUs are able to receive full credit for major gifts and above.
Collaboration Credit will only show when a proposal is tagged by PRM with the proper CC tags & the proposal is awarded. Collaboration Credit is audited using Workbook: LT03 | Campaign Collaboration Credit Review Report (utexas.edu) (viewable to leadership).
Example: Athletics & Engineering work together to solicit a multi-interest prospect for $1,000,000. In the proposal, both are set to receive $500,000 each. Instead of each CSU & gift officer only receiving credit for their half of the proposal, both will receive credit for the full amount.
Contact Report
Contact reports are substantive communication or event that moves a relationship forward.
Engagement Effort
A communication that may or may not move a relationship forward.
Building Block
To help reporting, it is derived from Purpose Codes to one of five areas: Faculty, Students, Buildings & Equipment, Programs, and Research.
| PURPOSE_CODE | PURPOSE | BUILDING_BLOCK_CODE | BUILDING_BLOCK |
| 06 | Faculty Support/Chairs | 1 | Faculty |
| 17 | Graduate Fellowships | 2 | Students |
| 12 | General Student Support | 2 | Students |
| 16 | Undergraduate Scholarships | 2 | Students |
| 18 | Grad OR Undergrad Scholarship | 2 | Students |
| 15 | Consumable Non-Mon | 3 | Buildings and Equipment |
| 10 | Equipment & Equipment Maint. | 3 | Buildings and Equipment |
| 04 | Buildings and Capital Items | 3 | Buildings and Equipment |
| 14 | Departmental Use | 4 | Programs |
| 99 | Other Restricted | 4 | Programs |
| 11 | Publications | 4 | Programs |
| 05 | Conf/Inst/Seminars/Workshops | 4 | Programs |
| 03 | Books and Manuscripts | 4 | Programs |
| 01 | Unrestricted | 4 | Programs |
| 02 | Art/Collections/Acquisitions | 4 | Programs |
| 13 | Research | 5 | Research |
Prospect Stages
From the Prospect Management Policy:
-
Cultivation = prospect manager has a written strategy documented in VIP for a solicitation of $100,000+ within the next 36 months and is making ongoing, substantive contacts with the prospect
-
Solicitation = prospect manager has presented prospect with a written proposal or gift agreement; verbal gift conversations must be followed with written documentation, which may include a letter, email, proposal or gift agreement, presented to the prospect; see “Solicitation & Proposal Protocol” below
-
Stewardship = a pledge or gift has been made and the prospect is not likely to be solicited for a new gift within the next 36 months. GOs may develop new $100,000+strategies for donors who are in stewardship and move them back into the solicitation cycle.
-
Principal Gift Prospect = used by RAs to enter prospects with $500,000+ capacity directly into GO portfolios; for tracking purposes, these prospects should be left in this stage until the GO begins active cultivation
-
Coordination = used by PMs who are orchestrating strategy and tracking a unified cultivation and solicitation plan for multi-interest prospects
Reporting Dates
| Name | Abbreviation | Definition |
| Fiscal Year | FY |
Fiscal Year runs from September 1-August 31. i.e. FY24 = 9/1/2023-8/31/2024 |
| Fiscal Year to Date | FYTD | From 9/1 of current fiscal year to current date |
| Fiscal Year End | FYE | End of Fiscal Year – 8/31 |
| Rolling 12 months |
Tracks previous 12 months from current month i.e. April 1, 2023-March 31, 2024, May 1, 2023-April 30, 2024 |
Visit Counts vs. Unique Visit Counts
Visit Counts: A count of total visits (either Scheduled in-person meeting or Zoom/Video call)
Unique visit: A count of distinct prospects visited
- Example: Gift officer meets with a prospect 3 times across in person & zoom visits. This counts as 3 visits but only 1 unique visit
SPUR Glossary of Terms
SPUR
System for Philanthropy and University Relations
Account
An account is an organization, company, household, or affiliated organization that you want to track – for
example, The Smith Foundation, Smith Hardware, John and Mary Smith, and Board of Trustees.
Account Type
Accounts are categorized into different types of records:
▪ Households are one or two persons (Contacts) in the same household.
▪ Corporations include public or private corporations, corporate foundations or philanthropic LLCs.
▪ Organizations include foundations, family foundations, organizations, religious organizations, donor
advised funds, estates, trusts and government offices.
▪ Affiliated Organizations include alumni associations chapters, boards, councils or giving societies
affiliated with UT.
▪ Institutional Units are UT colleges, schools, units and departments
Activity Report
Activity Reports — formerly Contact Reports, Engagement Efforts, and Next Steps — are used to record
interactions and tasks with donors. Activity Reports will have an indicator for substantive activity
Alternate Channels
The methods of contact for an Account or Contact record, including physical addresses, telephone numbers,
email addresses, Facebook accounts, URLs, etc. It is often a mode of communication through which a solicitation
can be made
App Launcher
An icon featuring nine dots in the top left of each page in SPUR that lists available Salesforce Apps and Objects
that are viewable based on your security settings. This menu provides a way to navigate most areas of the
system. The App Launcher is sometimes referred to as the waffle.
Awards
Recognition or honors given to individuals or organizations. Awards is one of the objects in SPUR that replaces
Activity Codes.
Batches
Groups of Gift or Pledge records processed together
Campaign
Grouping of constituents that can be communicated with, such as an appeal, direct mail, or newsletter list.
Campaign Members
Any Contact associated with a campaign.
Reporting Access
Reporting Tools
There are a multitude of reporting tools available to members of Texas Development. Some are managed by RAD others in VIP. Below is a table delineating which team manages each & how to contact each team.
| Tool | Team | Contact Method |
| Gift Report Writer | VIP | Business Service Detail – Service Portal (service-now.com) |
| Bio Report Writer | VIP | Business Service Detail – Service Portal (service-now.com) |
| Endowment Report Writer | VIP | Business Service Detail – Service Portal (service-now.com) |
| PREP | VIP | Business Service Detail – Service Portal (service-now.com) |
| Tableau | RAD |
For edits, new reports, errors: RAD Request | University Development Reporting (utexas.edu) For questions: reporting@austin.utexas.edu |
| Cognos | RAD |
New Cognos reports are not being created. For questions, errors: reporting@austin.utexas.edu |
| Michelangelo | RAD |
For field additions: RAD Request | University Development Reporting (utexas.edu) For questions: reporting@austin.utexas.edu |
Reporting Access Requirements
To gain access to Tableau, Michelangelo, and Cognos, please complete the following trainings: VI 100, VI 101, VI 220
General VIP notes:
- A user must login to VIP every 90 days to retain access
- Users must retake VI 101 annually to retain VIP access
- A user that changes roles within Texas Development must be up to date on VI 101. If not, user needs to retake course.
- Users that leave Texas Development later to return must retake all three courses to regain access to VIP + RAD reporting tools
Reporting Access Timelines
Below are the timelines for granted access & use availability
| Reporting Tool | Timeline for Access |
| VIP Report Writers (Bio/Gift/Endowment) | On a strict as needed basis. With the upcoming CRM conversion, access to these reports is exceedingly rare. Requests for access must be submitted using the VIP support form. All requests will be strictly reviewed. Users are encouraged to use RAD reporting tools to retrieve data |
| Tableau | Access is automatically granted the day following completion of the required trainings |
| Michelangelo | Access is manually granted weekly (typically Thursday mornings) |
| Cognos | Access is manually granted weekly (typically Thursday mornings) jointly by RAD & D2I. Depending on other priorities from both teams, this timeline is flexible |
Cognos
Error: Cognos Site is Not Accessible
- If off campus or on an un-authorized computer, make sure to connect over VPN. Cognos is not accessible unless on VPN.
- Click here for instructions on how to connect to a UT VPN.
- Please email devits@austin.utexas.edu with any questions on installing or setting up a VPN.
- Delete cookies and empty cache to reset reports and try again
- Contact reporting@austin.utexas.edu
Error: Javascript Error

Fix: The current Firefox update (version 68) breaks Cognos reports on a Mac. Please use Chrome when running reports. Then apply the following:
- Open the browser and clear the browsing history, cookies and cache.
- Clear any old java files. Here is a link with instructions on how to do so: https://www.java.com/en/download/help/plugin_cache.xml
Error: SQL Error

Fix:
- Rerun in a minute or two. If data is being refreshed in the morning, you might get this error due to running processes locking or re-writing data. Waiting a minute or two can allow the processes to finish up
- Be sure to reset the report (you will know it’s reset if the prompt page appears in place of the previously run data or the same error)
- Reset the report:
Rerun the report by navigating to the folder instead of the ‘Recent’ reports on the home page: 
If the error shows up before the prompt page is even loaded, this means the previous version of the report is being run and the reset did not happen as expected. Try to close the open report by using the dropdown welcome button:
- Rerun
- Clear the cache and cookies and rerun.
- Email reporting@austin.utexas.edu if the error persists.
Error: No Access

This error is typically encountered when you try to run a report by clicking on a ‘recent’ report on the homepage. If the report has been edited since you last ran it, there isn’t a previous version to run which results in ‘no access to the asset’. This can be fixed by going to the containing folder and running the report from there:

Tableau
Logging In
The simplest way to access Tableau reports is through the reporting website. You can access our website here: https://reporting.giving.utexas.edu/ Along the top of this website, select the third tab (REPORTS). This section is broken out into two sections, Development Reports and Unit Reports. Once you have selected a report, you will be asked to log in using UT EID credentials. You must have an active VIP account to access these reports. If you receive the error message “Resource not found” please contact reporting@austin.utexas.edu and ask that we verify your permissions.
Navigating Reports
Most reports developed in Tableau begin with an introduction or cover page. This page is intended to provide you with useful information about the report you are accessing. The page typically includes a brief overview of the report along with a contents section used to describe what is on each page of your report. You can find when the report was last updated in the bottom left of each page. Along the top you will find tabs to navigate to each page of your report.
The Toolbar
Along the bottom of each page, you will see a tool bar like the one below: ![]()
- Refresh allows you to refresh your report manually. Please note this will only refresh the connection to an extract and will not refresh the extract itself. Extracts are usually refreshed once a day.
- Pause allows you to pause automatic updates on the page you are currently on.
- View: Original allows you to revert the report back to its original view. This is useful if you have made changes to or hidden specific results within a report. The report will revert to its original state once closed.
- Edit allows you to, with permissions, edit a report directly through Tableau server.
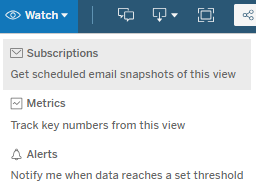
- Watch allows you to start a subscription, track metrics, or set alerts.
- Alert & Metrics allow you to set up an alert on a page within a report if a number drops below or above a defined value. Note this feature requires you to have an X and Y axis and will not work on tabular style reports.
- Subscribe allows your to subscribe yourself or others to a report. We will go into this further in the subscriptions section.
- Download allows you to download a report through various formats.
- Image downloads a .png file of the report page you are currently on.
- Data allows you to download the data behind a report. Please see the data section for more information on this.
- Crosstab allows you to download the data in a report to Excel and keep the same cross tabular formatting.
- PDF allows you to download a .pdf of your report. This also provides you with the option of downloading a single page, or the entire report. Most reports are designed specifically to fit this format. To download the entire report, verify the layout of your report (portrait or landscape), paper size should be set to letter unless otherwise specified. Scaling should be set to automatic. In the content section, select “Sheets in Workbook” and press “Generate”. You will then have a pop-up widow asking you to cancel or download. Select “Download”.
- Tableau Workbook allows users to download a tableau workbook version of the report they are interacting with. Please note this will only work if you have Tableau Desktop installed on your machine (you probably don’t).
- Full Screen allows the user to navigate from a webpage view of a report, to a full screen view.
Subscriptions
In Tableau, you can easily subscribe to reports that you need on a recurring basis.
Subscribe to reports to receive a snapshot of it by email without having to sign in to Tableau Server or Tableau Online.
Note: If you use Tableau Server, administrators determine whether subscriptions are enabled for a site.
Subscribe yourself or others to a view:
When you open a view in Tableau Server or Tableau Online, and you see a subscription icon () in the toolbar, you can subscribe to that view or the entire workbook. If you own a workbook or are a project leader or administrator, you can also subscribe other users who have permission to view the content.
- Open a view either directly, or after opening the containing workbook.
- In the toolbar above the view, click Watch then Subscriptions.
- Add the Tableau users or groups you want to receive the subscription.
- This causes the subscribe dialog box to appear as shown below.

- Select or enter the following values:
- Subscribe Users – enter the e-mail address associated with your account.
- Subscribe Users in Groups – select or enter the group name associated with the user.
- Include – choose whether to subscribe to the current sheet only or all sheets in the workbook.
- Schedule – select the schedule you’d like your snapshots to send on. These schedules are created and maintained by tableau server administrators.
- Subject – enter the desired subject for the subscription e-mail.
- Message – enter a custom message.
- Don’t send if view is empty – select this option is you don’t want to receive an email with empty view
- Subscribe Me – select this option if you want to subscribe yourself
- Click on Subscribe button to finish.
Note: To receive a subscription, users must have permission to view the content. If they use Tableau Server, their accounts must also have email addresses.
Unsubscribe yourself from a view
- Access your Tableau Server or Tableau Online account settings by doing one of the following:
-
- Click Manage my subscriptions at the bottom of a subscription email.
-
- Sign in to Tableau Server or Tableau Online. At the top of the page, select your name, and then select My Content.

- Click Subscriptions.
- Select the check box next to the view you want to unsubscribe from, click Actions, and then click Unsubscribe.
Subscribed dashboards/sheets will be delivered to your inbox in the form of a PNG image. The image contains links to the interactive version of the dashboard.
Downloading Data
Note: The download formats available to you depend on permissions granted by Tableau content owners and site administrators.
- At the top of a view, click Download.

- Select one of the following options:
-
- Image: Downloads an image of the view in .png format.
-
- Data: Opens a new tab in the browser window and displays the view’s data in summary and detail. You can then download the data as a comma-separated value (.csv) file. To download the underlying data, click Full Data. You can add or remove columns by clicking “Show Fields.” You can select all or pick and choose the fields you need! When ready, hit download.
When downloading from a dashboard, first click the specific sheet with data you want.
-
- Crosstab: Downloads the view, or the selected sheet in a dashboard, as a .csv file you can open in Microsoft Excel.
-
- PDF: Downloads a PDF of the view, specific sheets from a dashboard, or specific sheets from a workbook. Under Include, select the part of the workbook you want to download. Select specific sheets or select all. Select Scaling to control the image’s appearance on the PDF. Select Paper Size and Orientation. If you’re downloading a dashboard to PDF format, web page objects aren’t included.
-
- Tableau Workbook: Downloads a workbook you can open with Tableau Desktop.
Filters
Filters are an effective way to restrict the amount of data for analysis. Filters allows to customize the dashboard to specific needs. For example, if you want to filter based on a State, choose one or more values in a drop-down list as shown in below figure:

If you choose California state, the worksheet will display information only for the selected state.
Michelangelo
Logging In
You can access Michelangelo directly here: https://www.michelangelopro.com/#/
Press Login in the top right corner, select “University of Texas at Austin” in the “Select Organization dropdown, then press LOGIN. You will be automatically redirected to the UT SSO where you will enter your UT EID & password. After logging in, enter the UT Advancement Model.
Navigating Michelangelo
For a process document on how to use Michelangelo, click here
For a video tutorial on how to use Michelangelo, click here
Lookup Feature
For an additional video on how to use Michelangelo’s Lookup feature, click here
NOTE: To upload a list in the Lookup feature, your file MUST be in .csv format.
Downloading Data
To download your list, click the “Checkout” button in the bottom bar.
Here you can rename your report & select your output fields. A blue box with a white checkmark indicates that field will be included in the downloaded list.
Your list will export as a .csv file.
